Follow Us
81 Basic Stock Market Terms Every Beginner Must Know

Basic Terms in Stock Market: The Only Glossary You’ll Ever Need
Table of Contents
If you are trying to understand the stock market but feel overwhelmed by unfamiliar terms like P/E ratio, open interest, or delivery percentage, you are not alone.
The truth is, most newbies don’t lose money because of poor stock picks, they lose because they misunderstand the basic language the market operates on.
This article is a complete, well-structured glossary of over 80 essential stock market terms, carefully curated for both investors and traders. But it’s not just definitions.
You’ll learn:
- What each term actually means in practice
- How it’s used in real-world investing and trading
- Common misconceptions and traps to avoid
- How to apply this knowledge using tools like screeners, watchlists, and live data
Whether you are a long-term investor, short-term trader, or just starting out, this glossary will help you build the vocabulary you need to make informed decisions and interpret market behavior with greater confidence.
Why Stock Market Terminology Matters: Build Real Financial Fluency
Financial markets don’t wait. They move in real time, react to global triggers, and punish hesitation.
In this kind of environment, guessing what a term might mean isn’t just risky, it’s expensive.
Every chart, every quote, every financial report is built on terminology. If you don’t understand it, you can’t decode what’s really happening. And if you can’t decode it, you’re flying blind.
Let’s break it down.
Financial Language = Financial Intelligence
The stock market has its own vocabulary and just like in any technical field, that language forms the basis of how decisions are made.
Words like liquidity, P/E ratio, or support levels are not just academic terms. They are signals. Miss the signal, and you miss the move.
Being fluent in this language is a core part of what separates experienced investors from uninformed speculators.
Memorization Is not the Goal – Recognition Is
You don’t need to remember the textbook definition of enterprise value to be successful. But you do need to recognize what it tells you, about how a company is being valued, and whether that valuation makes sense in context.
The goal here isn’t rote learning. It’s pattern recognition. Knowing how terms interact, where they show up, and what they imply when they do.
Misunderstand a Term, Pay the Price
Let’s say you mistake market order for limit order. You end up buying a stock at a far higher price than you expected, because the system executed your order instantly at the available ask. That’s not just a definition problem. That’s a loss.
Or maybe you think dividend yield automatically means the company is doing well. You jump in for the “income,” only to watch the stock price collapse, because you didn’t check the payout sustainability or earnings trend.
These aren’t rare errors. They’re daily mistakes made by thousands of traders and investors who skipped the basics.
Bottom line?
If you want to play this game with real stakes, you need to speak the language. This glossary gives you that, not just to look smart, but to act smart.
Essential Stock Market Terms Every Investor Should Know
1. Stock
A stock represents ownership in a company. When you own a stock, you own a piece of that business – including its assets, earnings, and future prospects.
2. Share
A share is a single unit of stock. Think of stock as the whole pizza, and shares as individual slices. If a company has issued 1 crore shares, and you own 10,000, you own 0.01% of that company.
3. Equity
This is a broad term that refers to ownership value. In investing, equity usually means your claim in a company’s assets after all debts are paid. When you buy stocks, you’re buying equity.
4. Company
A legally registered business that can raise capital, issue shares, and be publicly traded (if listed). You are not just betting on a name – you’re buying into its business model, leadership, and balance sheet.
5. IPO (Initial Public Offering)
This is when a private company sells its shares to the public for the first time and gets listed on a stock exchange.
An IPO is often hyped but unless you understand valuation and lock-in periods, don’t treat it as a guaranteed win.
6. Demat Account
Short for dematerialized account, this is where your shares are stored electronically. It’s like a digital locker for your holdings.
7. Trading Account
This is what you use to place buy or sell orders. While your Demat account holds your shares, your trading account is where the actual action happens – the execution side.
8. Stock Exchange (NSE, BSE)
These are the platforms where stocks are listed and traded.
- NSE (National Stock Exchange): More volume, often preferred for intraday trades.
- BSE (Bombay Stock Exchange): Older, but still widely used, especially for long-term holdings.
9. Broker
A broker is your middleman, the platform or firm through which you trade.
Many investors treat brokers as passive facilitators. In reality, your broker influences speed, cost, and even access to certain instruments.
Choose wisely. The quality of your broker can affect your execution speed, fees, and even which stocks or IPOs you get access to.
10. Ticker Symbol
This is the shorthand identifier for a company’s stock – like INFY for Infosys or RELIANCE for Reliance Industries. It’s how stocks are tracked, quoted, and discussed across platforms.
Bottom line:
Before you chase strategies or screeners, nail these basics. If you can’t explain the difference between a trading account and a Demat account, you’re not ready to trade yet. Learn the structure, then play the game.
Stock Classifications
Not all stocks are created equal. And if you think buying “cheap” stocks guarantees big returns, you’re setting yourself up for disappointment.
Understanding stock classifications helps you choose what to invest in based on your goals, risk appetite, and strategy.
11. Common Stock
This is what most investors buy. It gives you ownership in a company and voting rights. But in case the company goes under? You’re last in line to get paid.
12. Preferred Stock
This class of shares typically offers fixed dividends and priority over common stockholders when it comes to payouts but usually no voting rights. Think of it as a hybrid between stocks and bonds.
13. Blue-Chip Stock
These are large, financially sound companies with a solid track record, like Reliance, TCS, or HDFC Bank. They are not flashy, but they are built to last. Ideal for long-term investors who value consistency over hype.
14. Large Cap / Mid Cap / Small Cap
Market capitalization categories in India are defined by SEBI using a rank-based system, not fixed rupee amounts.
This classification is reviewed and updated every six months based on companies’ total market value.
- Large Cap: Companies ranked 1 to 100 by full market capitalization. These are the biggest players in the market – stable, highly liquid, and closely tracked by institutional investors.
- Mid Cap: Companies ranked 101 to 250. These firms offer a balance of growth and moderate risk. They are typically in expansion mode with increasing market presence.
- Small Cap: Companies ranked 251 and beyond. These are smaller, less liquid companies that carry higher risk but can deliver outsized returns if they scale successfully.
15. Growth Stock
These companies reinvest profits to fuel expansion, which means they typically don’t pay high dividends. You’re betting on future performance, not current income.
16. Value Stock
These are undervalued by the market, at least on paper. The classic “buy low” approach. But beware: sometimes they’re cheap for a reason.
17. Penny Stock
Low-priced stocks, often trading under ₹10 or ₹20. They promise quick profits, but more often deliver quick losses.
Penny stocks may look attractive due to their low prices. However, their volatility and lack of liquidity make them highly speculative.
Avoid unless you fully understand the risks and can afford to lose.
18. Dividend Stock
These stocks regularly pay out a portion of the company’s earnings to shareholders. Great for income-focused investors, especially in stable sectors like utilities, FMCG, or banking.
When building a portfolio, classification helps you diversify – not just by company name, but by type of stock. Know what role each one plays, and you’ll avoid putting all your risk in one basket.
Market Indexes & Funds
Indexes and funds are the tools most investors use to track the market or invest in the market without picking individual stocks.
If you’re not using them or at least watching them, you’re missing the big picture.
Let’s get clear on what they are and why they matter.
19. Index (Sensex, Nifty, S&P 500)
An index is a benchmark, a basket of selected stocks that reflects a specific segment of the market.
- Sensex: Top 30 companies on the BSE.
- Nifty 50: Top 50 companies on the NSE.
- S&P 500: Leading 500 US companies, widely tracked globally.
Think of indexes as the “pulse” of the market. When Nifty 50 rises, it means India’s largest listed companies are doing well overall.
It doesn’t mean your stocks are up, but it gives you a macro view of sentiment and direction.
20. Index Fund
An index fund is a mutual fund that mimics a particular index. For example, a Nifty 50 index fund holds the same 50 companies in the same proportion.
It’s passive, low-cost, and often a smart entry point for beginners who don’t want to pick stocks.
21. ETF (Exchange-Traded Fund)
An ETF is like an index fund, but it trades on the stock exchange like a regular stock. You can buy and sell it during market hours.
Some ETFs track indexes, others track sectors (like banking or IT), commodities (like gold), or themes (like ESG).
Long-term investors often use ETFs for diversification, while active traders follow indices to monitor momentum and trend shifts.
ETFs combine the best of both worlds: diversification and liquidity. You get exposure to a group of assets with the ability to trade instantly, like a stock.
Bottom Line:
Indexes help you track the market. Index funds and ETFs help you invest in it efficiently. If you’re unsure where to start or want to avoid emotional stock picking, these are tools worth understanding deeply.
How Stock Market Trade Execution Works: Order Types & Mechanics
Trading is not just about what stock you buy, it’s about how you buy it.
If you don’t understand order types and execution mechanics, you’ll constantly blame your broker or the market for mistakes that were entirely avoidable.
22. Market Order
This is the simplest type: buy or sell immediately at the best available price.
It guarantees execution, but not price. So in volatile conditions, you may end up paying more (or receiving less) than expected.
Use when: Speed matters more than price.
23. Limit Order
You specify the exact price at which you want to buy or sell. The trade will only execute if the market hits your price.
Use when: You care about price control and can wait.
Scenario:
A trader places a limit order for ₹2200. The stock reaches ₹2210 and reverses. The order never executes – not because of a broker error, but because the execution logic was misunderstood.
Lesson? The stock must touch or cross your exact limit price, near misses don’t count.
24. Stop-Loss Order
Designed to protect you. It gets activated when the stock hits a certain price, then becomes a market order to prevent deeper loss.
Example: You hold a stock at ₹300 and place a stop-loss at ₹285. If it falls to ₹285, it auto-sells.
Caution: In fast markets, the executed price can be worse than your stop, especially in low-volume stocks.
25. GTC (Good Till Cancelled)
Most orders expire at the end of the trading day. A GTC order remains active until it’s either filled or manually canceled, useful if you’re targeting a specific price but don’t want to re-enter the order daily.
26. Trigger Price
Used in stop-loss and stop-limit orders. It’s the price at which your order becomes active.
Example: You set a stop-loss sell order for ₹280 with a trigger price of ₹285. When the stock hits ₹285, the order is sent to the exchange.
Think of the trigger price as the switch, and the actual order as the action.
27. Square Off
Closing your open position in the same trading day, especially in intraday trades. If you don’t manually square off by cut-off time, most brokers will do it automatically (and charge a fee).
28. BTST / STBT (Buy Today, Sell Tomorrow / Sell Today, Buy Tomorrow)
- BTST: You buy shares today and sell them tomorrow before delivery hits your Demat.
- STBT: The opposite, you short-sell today and plan to cover tomorrow (usually in derivatives, as cash market short-selling isn’t allowed in delivery trades).
These trades can generate quick returns or fast losses due to price gaps between sessions.
Price Discovery and Transaction Metrics
Think you’re buying a stock at ₹100 just because that’s what you see on screen? Think again. The price you see and the price you get can be two different things, especially if you don’t understand how price discovery works.
Here’s what actually drives the numbers behind your trades:
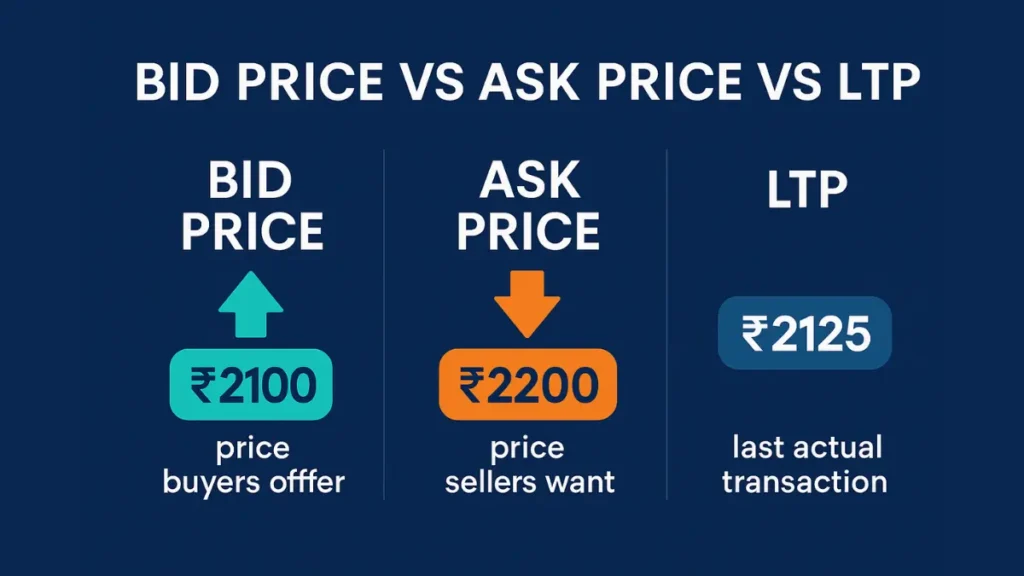
29. Bid Price
The highest price a buyer is willing to pay for a stock at a given moment.
If you’re trying to sell, this is the price you’ll get assuming you accept the best available offer.
30. Ask Price
Also called the offer price, this is the lowest price a seller is willing to accept.
If you’re buying, this is what you’ll pay, if you want instant execution.
31. Bid-Ask Spread
This is the difference between the bid and ask price. In liquid stocks (like Reliance or Infosys), the spread is tight, sometimes just a few paise. In illiquid or low-volume stocks, it can be massive.
Note:
Bid-ask spread can erode profitability, especially in low-volume or illiquid stocks.
Translation: Even if a stock moves in your favor, the spread might eat into your profits (or turn a trade into a loss).
32. Last Traded Price (LTP)
The most recent price at which a transaction took place. This is the number most people quote but it doesn’t guarantee you’ll get in or out at that price.
Important: LTP reflects what just happened not necessarily what will happen in your next trade.
33. Closing Price
This is the final price at which a stock is traded for the day but here’s the nuance:
In Indian markets, the closing price is usually the weighted average of the last 30 minutes of trading, not just the last tick.
So if the stock ends the day with a sharp spike or dip, the closing price may not reflect that final move.
Volume and Liquidity Analysis
Price tells you what is happening. Volume tells you how seriously you should take it. Liquidity tells you whether you can act on it without getting burned.
34. Volume
This is the total number of shares traded in a given period – intraday, daily, weekly, etc.
High volume confirms price moves. A breakout with heavy volume? Strong signal. A breakout with weak volume? Probably a fakeout.
Volume is not just a number. It’s conviction from buyers, sellers, or both.
35. Liquidity
Liquidity tells you how easily you can buy or sell a stock without affecting its price too much.
Highly liquid stocks (like TCS or HDFC Bank) can absorb large orders with minimal price impact. Illiquid stocks? You’ll struggle to enter or exit without slippage.
Why it matters:
- Liquidity = flexibility.
- Illiquidity = traps.
36. Delivery Percentage
This is the portion of shares bought that were actually taken for delivery not squared off intraday.
A high delivery percentage (especially on up days) suggests buyers are in it for the long haul. They are not just flipping trades instead they’re accumulating.
A high delivery percentage with increasing volume often indicates institutional interest, a potential early signal of accumulation.
In plain English: When big money buys and holds, it’s worth paying attention.
37. Float
The total number of shares available for public trading (excluding promoter holdings or locked-in shares).
It’s the stock’s circulating supply. The lower the float, the more volatile the stock can be because even moderate demand can move prices sharply.
38. Free Float
A refined version of float, it excludes not just promoter shares, but also any locked-in or non-tradable institutional holdings. This is the actual number of shares freely available in the market.
Why it matters?
Free float is what index funds and ETFs look at when weighting stocks. It also impacts volatility, liquidity, and how easily a stock can be manipulated.
Understanding Market Trends and Sentiment
The market is not just numbers on a screen, it’s psychology in motion. Every price tick reflects emotion: greed, fear, hope, or panic.
If you can’t read the market’s mood, you will always be late to the real moves.
Understanding trends and sentiment helps you align your strategy with what the market is actually doing not what you want it to do.
39. Bull Market
This is when prices are rising steadily across sectors. Optimism is high, and buyers dominate.
In bull markets, bad news is often ignored, and “buy the dip” becomes the default mindset.
Key trait: Momentum feeds momentum.
40. Bear Market
Prices are falling often sharply and pessimism sets in. It is not just a dip; it’s a prolonged downtrend, typically marked by a 20% or more fall from recent highs.
Warning: In bear markets, even good stocks bleed. Cash is a position too.
41. Sideways Market
Also called a range-bound market. Prices neither rise nor fall significantly they just move within a tight band.
Many novice traders are unprepared for sideways markets. These periods require different strategies than bullish or bearish conditions.
Why it matters: Most breakout traders fail in sideways phases. These periods demand patience, not aggression.
42. Volatility
This is how much and how fast prices move. High volatility = big swings, often unpredictable.
Volatility isn’t good or bad, it’s an opportunity and a risk. But if you’re not positioned right, it will eat you alive.
Trade small during high volatility unless you are sure of your setup. Big volatility cuts both ways.
43. Circuit Limit
To prevent extreme panic or euphoria, exchanges set circuit breakers, price bands within which a stock can move on a given day.
44. Upper Circuit
The highest price a stock can touch in a session. Once hit, trading is frozen — no more buyers can push it further.
Often seen in: Penny stocks, pump-and-dump schemes, and sudden announcements.
45. Lower Circuit
The lowest price a stock can fall to in a session. Once hit, panic selling gets blocked but that doesn’t mean the pain is over.
Getting trapped in a lower circuit means you may not be able to exit even if you want to.
46. Market Sentiment
This is the overall mood of the market – bullish, bearish, cautious, euphoric. Sentiment is shaped by news, earnings, global events, and even social media.
Ignore sentiment, and you’ll constantly fight the trend. Read it well, and you can position early before the crowd catches up.
Bottom Line:
Trends show direction. Sentiment reveals intent. If you can read both, you stop reacting to the market and start anticipating it.
Financial and Valuation Metrics
Valuation metrics help you answer the most important question in investing: Is this stock worth the price?
Let’s break down the real meaning behind the most-used and most-misunderstood valuation terms:
47. Market Capitalization (Market Cap)
This is the total value of a company’s outstanding shares.
Formula: Stock Price × Total Shares Outstanding
It helps classify companies as small-cap, mid-cap, or large-cap, but it’s not a measure of how “expensive” a stock is.
A ₹50 stock can have a higher market cap than a ₹2,000 stock. Price ≠ size.
48. Book Value
Represents the company’s net asset value: total assets minus total liabilities.
If the company were liquidated today, this is what shareholders might get.
But in modern, asset-light businesses (like tech), book value often has limited relevance.
49. Face Value
This is the original value assigned to a share when issued, typically ₹1, ₹2, or ₹10 in India.
It’s mostly used for accounting and calculating dividends or splits. It has zero connection to the stock’s market price.
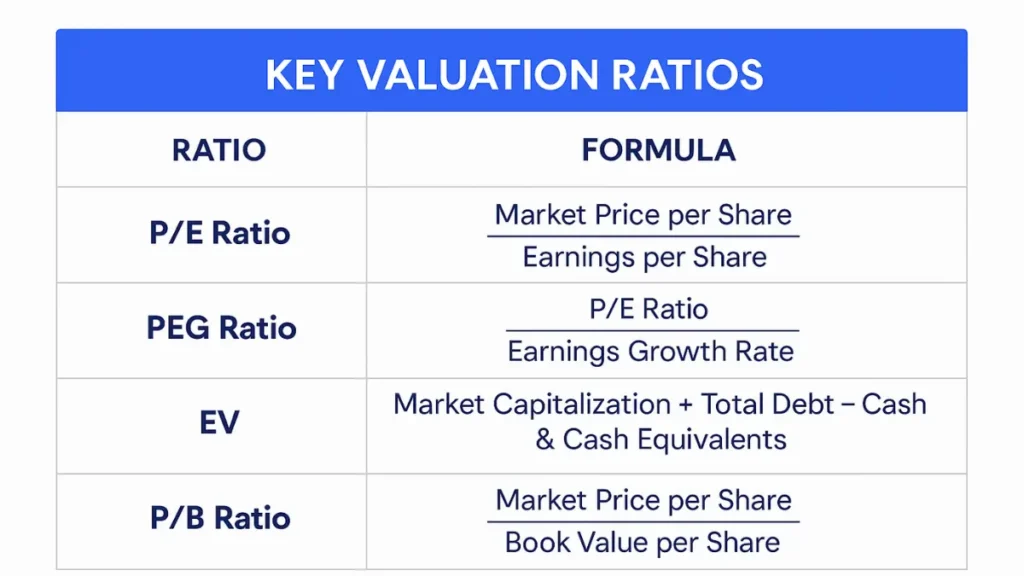
50. Enterprise Value (EV)
A more complete measure of a company’s worth, includes market cap plus debt minus cash.
It gives a clearer picture of what it would actually cost to buy the company. Especially useful in M&A analysis and when comparing businesses with different debt levels.
51. P/E Ratio (Price to Earnings)
The most quoted and most misused valuation metric.
Formula: Market Price ÷ Earnings Per Share (EPS)
It shows how much the market is willing to pay for each rupee of earnings.
Low P/E doesn’t always mean undervalued. High P/E doesn’t always mean overvalued. Context matters – growth potential, industry standards, and earnings quality all play a role.
52. PEG Ratio (Price/Earnings to Growth)
This adjusts the P/E ratio based on expected earnings growth.
Formula: P/E ÷ Projected Earnings Growth Rate
Useful for comparing high-growth companies, a PEG near 1 is often considered “fair value.”
But here’s the trap: it relies on forecasts. If the projections are wrong, the ratio is meaningless.
53. P/B Ratio (Price to Book)
Formula: Market Price ÷ Book Value per Share
Used to identify undervalued or overvalued stocks based on their asset base.
Most relevant for asset-heavy sectors like banking or manufacturing, less useful for tech or services.
Common Misinterpretations
| Metric | Indicates | Common Error |
| P/E Ratio | Relative price vs earnings | Assuming low P/E = undervalued |
| Book Value | Net asset value | Ignoring relevance in modern firms |
| PEG Ratio | Growth-adjusted valuation | Over-reliance on forecast accuracy |
Bottom Line:
Valuation metrics are not green lights or red flags. If you use them in isolation, you’ll get fooled. Use them in context, and they’ll help you avoid overpaying for hype or ignoring hidden value.
Profitability and Performance
Valuation tells you what a stock costs. Profitability tells you what the business earns. If you skip this section and invest blindly, you’re just paying for a name not performance.
These metrics go straight to the heart of business quality. Here’s how to read them like a pro:
54. EPS (Earnings Per Share)
EPS is the portion of a company’s profit allocated to each outstanding share.
Formula: Net Profit ÷ Number of Shares
Higher EPS generally indicates better profitability but don’t compare EPS blindly across sectors. Capital structure, debt, and accounting practices can skew the picture.
Companies can inflate EPS by reducing the number of shares (buybacks) not by actually growing profits.
55. EBITDA
EBITDA (Earnings Before Interest, Taxes, Depreciation, and Amortization) is a proxy for operational performance. It strips away financing and non-cash expenses to give a cleaner look at core profitability.
Useful for comparing companies with different capital structures especially in sectors like telecom, infrastructure, or manufacturing.
Just because a company has strong EBITDA doesn’t mean it’s profitable overall, interest and taxes still exist.
56. ROE (Return on Equity)
Formula: Net Profit ÷ Shareholder’s Equity
This tells you how efficiently a company is using shareholders’ capital to generate profit.
A high ROE = strong returns, if it’s backed by real earnings and not excessive leverage.
A rising ROE with stable or falling debt is a healthy sign. If it’s rising because of rising debt, tread carefully.
57. ROCE (Return on Capital Employed)
Formula: EBIT ÷ (Total Capital Employed)
Unlike ROE, ROCE includes both equity and debt making it a more holistic measure.
Especially useful when analyzing capital-intensive businesses (e.g., auto, real estate, infrastructure).
ROCE > cost of capital = wealth creation.
58. Operating Margin
Formula: Operating Profit ÷ Revenue
This shows how efficiently a company converts revenue into operating profit. The higher the margin, the better the cost control and pricing power.
Margins vary by industry. Compare within sector, not across.
59. Net Profit Margin
Formula: Net Profit ÷ Revenue
This is the bottom line, what percentage of revenue becomes pure profit after all expenses.
It reveals pricing power, cost efficiency, and scalability.
Example: A 10% net margin means the company keeps ₹10 for every ₹100 in revenue. That’s real money, not just on paper.
Bottom Line:
Strong profitability doesn’t guarantee a good stock but weak profitability always demands a reason.
These numbers cut through the noise and show whether the business behind the stock is actually worth owning. Don’t just buy the brand. Check the margins.
Capital Structure and Dividends
A company’s capital structure reveals how it funds its growth through equity, debt, or both. And dividends? They’re not just extra cash in your account, they signal how confident the company is about its future.
But don’t be fooled: Not all high dividends are a blessing. Sometimes, they’re a red flag in disguise.
Let’s break it down:
60. Debt to Equity Ratio
Formula: Total Debt ÷ Shareholder’s Equity
This shows how much of the company’s operations are financed by borrowed money versus owners’ funds.
- A ratio below 1 generally indicates financial stability.
- A high ratio may suggest aggressive borrowing which amplifies both profits and risk.
Debt is not evil. But excessive debt, especially in a slowing business, can break it.
61. Dividend Yield
Formula: Annual Dividend per Share ÷ Current Share Price
It tells you how much cash flow you’re getting from a stock, relative to its price.
Example: If a ₹100 stock pays ₹5 annually, the yield is 5%.
A high dividend yield may signal financial weakness, especially if accompanied by falling stock prices.
Translation: Don’t assume a high yield means the company is generous. Sometimes, it just means the stock has tanked and the payout may not last.
62. Dividend Payout Ratio
Formula: Dividends ÷ Net Profit
This shows how much of the company’s profit is being returned to shareholders.
- A low ratio = company is reinvesting in growth.
- A high ratio = prioritizing shareholder return but may limit reinvestment.
Ideal balance: Sustainable payout without compromising growth.
63. Ex-Dividend Date
The cut-off date. If you buy the stock on or after this date, you won’t receive the upcoming dividend.
To receive the dividend, you must own the stock before the ex-dividend date.
64. Record Date
This is the date on which the company checks its records to confirm eligible shareholders for the dividend. It’s usually one working day after the ex-dividend date.
Important: You only need to track the ex-dividend date to qualify, the record date is more of a backend technicality.
Bottom Line:
A healthy capital structure gives a company room to grow. A thoughtful dividend policy rewards shareholders without sacrificing that growth. But don’t blindly chase yields — always ask: Can the company actually afford this? Or is it just buying time?
Institutional & Insider Activity Indicators
When big players move, smart investors watch. The actions of promoters, institutions, and insiders often speak louder than price charts or analyst opinions. These indicators reveal who’s betting real money and whether they’re buying, selling, or just buying time.
Here’s what to track and what to question:
65. Open Interest (OI)
Open Interest refers to the total number of outstanding contracts (futures or options) that haven’t been settled.
- Rising OI with rising prices = fresh long positions (bullish)
- Rising OI with falling prices = fresh shorts (bearish)
- Falling OI = unwinding (neutral to caution)
Why it matters: OI shows commitment. Unlike volume, which resets daily, OI tells you where positions are building or collapsing.
66. Promoter Holding
This is the percentage of company shares held by its promoters — founders, owners, or major stakeholders.
- High promoter holding can signal strong confidence.
- Steady or increasing promoter stake is generally a positive sign.
But don’t stop at the percentage check what they’re doing with those shares.
67. Pledging of Shares
This is when promoters use their shares as collateral for loans.
Caution:
Excessive pledging by promoters can indicate liquidity stress. Investigate further before investing.
Red flag: If promoters are heavily pledged and the stock falls, lenders may force-sell triggering a downward spiral.
68. Buyback
A buyback is when the company repurchases its own shares from the market.
It reduces the share count and can signal that the company believes its stock is undervalued.
But beware: Not all buybacks are shareholder-friendly. Some are used to boost EPS artificially or offset dilution.
69. Bonus Issue
A free additional share issue to existing shareholders, usually in a set ratio (e.g., 1:1).
This doesn’t increase your total investment value it just increases the number of shares, while reducing the share price proportionally.
Think of it as: A pizza cut into more slices, you still own the same amount.
70. Stock Split
This divides each existing share into multiple new shares to make the stock more affordable or liquid.
Example: A 1:5 split turns 1 share of ₹1,000 into 5 shares of ₹200 each.
Important: Splits don’t create value, they just adjust the math. But they often attract retail interest post-split.
71. Rights Issue
An offer to existing shareholders to buy additional shares at a discount.
It’s a way for the company to raise capital usually for expansion, debt repayment, or working capital.
Green or red flag? Depends on the reason. Dig into the purpose before subscribing blindly.
72. Short Selling
Selling a stock you don’t own, betting that its price will fall. You borrow the stock, sell it, then aim to buy it back cheaper.
While short selling is common in the derivatives market, it’s restricted in India’s cash market (only intraday allowed).
Key takeaway: Heavy short interest can lead to short squeezes where price spikes rapidly as shorts rush to cover.
73. Leverage / Margin Trading
Borrowing money from your broker to take larger positions than your actual capital allows.
Pros: Amplifies gains.
Cons: Also amplifies losses, quickly and painfully.
If you don’t understand margin calls and risk limits, stay away. The market won’t wait while you figure it out.
Bottom Line:
Institutional and insider activity reveals what the smart money is doing before the headlines catch up.
Track these indicators with context, not just excitement. Because when insiders run for the exit, retail investors usually don’t get the memo until it’s too late.
Technical Analysis Concepts
Charts don’t lie but they don’t hand out money either. To read a chart effectively, you need more than trendlines and indicators.
You need to understand what they actually mean and how traders use them to act with precision.
74. Support & Resistance
- Support: A price level where buying interest is strong enough to prevent further decline.
- Resistance: A price level where selling pressure overpowers buyers, halting the rally.
Markets respect these zones not because they’re magic but because traders believe in them. Watch for how price behaves near these areas, not just the levels themselves.
75. Breakout / Breakdown
- Breakout: Price moves above a defined resistance with strong volume.
- Breakdown: Price falls below a defined support zone.
Breakouts without volume are suspect. Real moves have conviction behind them.
Rule of thumb: No volume = no trust.
76. Moving Averages (SMA / EMA)
- SMA (Simple Moving Average): Averages price over a set period, smoothens out noise.
- EMA (Exponential Moving Average): Gives more weight to recent prices — more responsive.
Common uses:
- 50-day and 200-day SMAs for trend confirmation
- 20-day EMA for short-term trading
Crossovers (e.g., 50-day crossing above 200-day) are often used to identify bullish or bearish shifts but only when backed by volume and price structure.
77. VWAP (Volume Weighted Average Price)
Shows the average price of a stock, weighted by volume, throughout the trading day.
Why it matters:
- Institutions use VWAP as a benchmark.
- Retail traders use it for intraday bias – price above VWAP = bullish, below = bearish.
VWAP is like a magnet. Price tends to gravitate toward it during consolidations.
78. RSI (Relative Strength Index)
Momentum indicator that measures how overbought or oversold a stock is – on a scale from 0 to 100.
- Above 70 = Overbought
- Below 30 = Oversold
But don’t blindly sell at 70 or buy at 30. In strong trends, RSI can stay extreme for days.
79. MACD (Moving Average Convergence Divergence)
Tracks momentum and trend changes via two EMAs and a histogram.
- Bullish signal: MACD line crosses above the signal line.
- Bearish signal: MACD line crosses below.
Best use: Confirming existing trends or spotting early momentum shifts but don’t use it in sideways markets. It lags in choppy price action.
80. Trendline
A diagonal line connecting higher lows (in an uptrend) or lower highs (in a downtrend).
Trendlines are subjective but powerful, they visualize the direction and strength of a move. Break of a well-respected trendline often signals a shift in trend.
Don’t force it. A forced trendline is a dangerous illusion.
81. Candlestick Pattern
Candlesticks reveal price behavior within a specific time period and patterns can signal reversals or continuations.
- Doji: Indecision
- Hammer: Potential bottom
- Engulfing: Strong reversal signal
- Marubozu: Momentum bar with no wicks — full conviction
Key: Candlesticks only matter in context – near support, resistance, or after clear trends.
Commonly Confused Terms
In the market, small misunderstandings create big losses. Many beginners think they understand a term until they realize too late that it meant something else entirely.
This section clears up the deceptively similar concepts that confuse even smart investors.
These subtle differences often lead to major misunderstandings, especially among new investors.
Let’s make sure you are not one of them.
Stock vs Share
- Stock is a general term referring to ownership in one or more companies.
- Share is the specific unit of ownership in a particular company.
Think of stock as a category. Shares are what you actually buy.
Book Value vs Market Value
- Book Value is the company’s accounting value: assets minus liabilities.
- Market Value is what the market thinks the company is worth i.e., the current share price × total shares.
Just because a stock trades below book value doesn’t mean it’s undervalued. It could be rightly punished.
Dividend Yield vs Dividend Payout Ratio
- Dividend Yield = Dividend ÷ Share Price (tells you the return on your investment)
- Dividend Payout Ratio = Dividend ÷ Earnings (tells you how much profit is paid out)
A high yield with a high payout ratio might look tempting until you realize it’s unsustainable.
Face Value vs Market Price
- Face Value is the original value of the share when issued often ₹1, ₹2, or ₹10.
- Market Price is what you pay on the exchange today.
Face value is used for things like splits and dividends not for deciding if a stock is cheap.
Float vs Free Float
- Float is the total number of shares available for trading (excluding promoter holdings).
- Free Float further excludes shares held by institutions or locked-in investors.
Free float is the more precise measure used in index calculations and liquidity analysis.
Order Price vs Trigger Price
- Order Price is the price at which you want to buy or sell.
- Trigger Price activates the order often used in stop-loss setups.
If your trigger price isn’t hit, the order never becomes active — and you might miss your exit entirely.
Bottom Line:
These aren’t just technicalities. Misunderstanding them can cost you trades, profits or worse, confidence. Master the fine print, because in markets, precision is protection.
The Market Speaks, Now You Understand It
Markets don’t reward effort. They reward understanding. If you have made it this far, you now hold the vocabulary that underpins every price movement, every institutional trade, and every retail mistake.
The difference between a gambler and a serious market participant isn’t strategy, it’s fluency.
Start applying what you’ve learned:
- Pick 5–7 high-impact terms and track them live during market hours.
- Use this glossary as a filter: every stock idea, every chart, every tip, run it through these terms.
Because in this game, the market owes you nothing but it respects those who speak its language.
Disclaimer:
This content is for informational purposes only and should not be considered financial advice.
Read full Disclaimer.