Follow Us
Quantitative Trading Explained: Strategies, Tools & How to Start

Table of Contents
What Is Quantitative Trading?
Quantitative trading is a method of trading that uses mathematical models, statistical analysis, and historical data to make decisions.
Instead of relying on opinions or emotions, quant traders follow a set of rules based on data to identify trading opportunities.
These strategies are often automated and tested thoroughly before being used in live markets.
How Quantitative Trading Differs from Traditional Trading
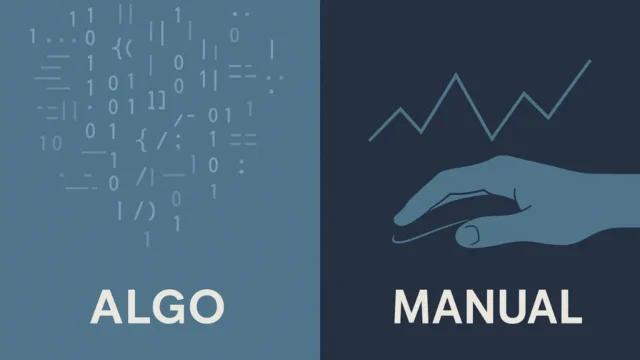
Traditional (or discretionary) traders rely on human judgment. They look at patterns, follow news, and use experience to decide when to trade. It’s more subjective.
Quant traders take a different route. They design and test systems based on data. The goal is to remove emotion and follow a set of predefined rules that have been tested over thousands of past trades.
In short:
- Discretionary traders react to the market.
- Quant traders prepare for the market.
Why Retail Traders Are Embracing Quant Strategies
Today, you have more access to data, free APIs, cloud computing, and platforms that didn’t exist 10 years ago. Python is free. Data is everywhere. And you can backtest your ideas without needing a hedge fund budget.
That’s why retail traders, small teams, and independent developers are moving into quant territory. It levels the playing field, if you’re willing to put in the work.
Debunking Common Quant Trading Myths
- “Quant trading is only for math geniuses or quants at banks.”
No, it’s not. Most of it is logic and pattern recognition. You don’t need to be a PhD or even great at math, you just need to be structured and curious. - “You need a ton of capital to get started.”
You can begin with paper trading or a small live account. The tools are free or low-cost. - “If I can’t code, I can’t be a quant trader.”
Wrong again. While coding helps (especially Python), you can start with platforms that require little or no code. Learning basic scripting is easier than you think.
Quant trading is not a magic bullet. But if you’re tired of emotional trading, random strategies, and chasing signals, it’s a smarter way to think about the markets.
And once you understand how it works, you’ll never want to trade any other way.
How Quant Strategies Work: Key Components Explained
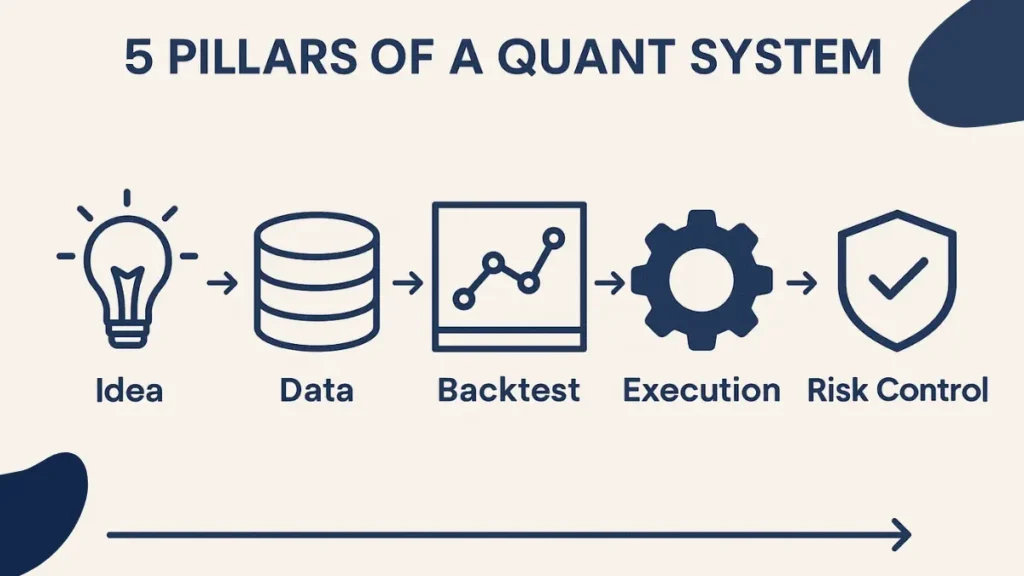
At the core, quant trading is about building a system that can trade for you; based on rules, not emotions.
Every quant strategy, no matter how simple or complex, follows a clear process. It’s methodical.
Here’s how it works.
1. Idea Generation
Every strategy starts with a hypothesis, something you believe the market tends to do.
That might be:
- Stocks that drop sharply in one day often bounce back the next.
- Momentum works better in large caps than small caps.
- High volume breakouts have more follow-through.
You turn that idea into logic: If X happens, do Y.
The key here is curiosity. You don’t need 50 ideas. You need one solid one that makes sense and can be tested.
2. Data Collection
Once you have a trading idea, you need data to test it. This could be:
- Price data (open, high, low, close, volume)
- Fundamental data (earnings, P/E ratios)
- Alternative data (news sentiment, social media trends)
The quality of your data matters more than the quantity. Inaccurate or messy data will give you misleading results.
Retail traders now have access to free and affordable data sources through various APIs.
3. Backtesting
This is where you test your idea using historical data. The goal is to see how your rules would’ve performed in the past.
Backtesting answers:
- Would this strategy have made money?
- What was the risk (drawdowns)?
- How often did it trade?
- What’s the win rate and average profit/loss per trade?
But here’s the warning: just because a strategy worked in the past doesn’t mean it will work in the future. That’s why proper validation and testing methods (covered later) are critical.
4. Execution
Once your strategy passes backtesting, you prepare it for real-world execution. This involves turning your strategy into code (if it’s not already), connecting it to a broker via an API, and deciding how trades will be placed.
Things to consider:
- Will you use market or limit orders?
- Can your broker handle the speed and volume?
- How will you avoid slippage or bad fills?
Poor execution can kill a profitable strategy. This is where many retail traders lose their edge, thinking backtest results will translate 1:1 into real trades.
5. Risk Management
Even the best strategy can blow up if risk isn’t managed. This part is non-negotiable.
Your strategy should define:
- How much capital to risk per trade
- Maximum number of open trades
- What happens during losing streaks
- When to reduce exposure or pause the strategy
This is where many beginner quants fail. They focus on performance, not protection. But smart risk controls keep you in the game long enough for your edge to play out.
Rule Based vs. Model Driven Approaches
There are two main types of quant systems:
- Rule-Based Strategies: These follow specific logic. For example, “Buy when the 10-day moving average crosses above the 50-day.” Easy to explain. Easy to test.
- Model-Driven Strategies: These rely on statistical models or machine learning to find signals. They’re more complex and harder to interpret, but can uncover patterns humans might miss.
If you are just starting, stick with rule-based. It is easier to debug, monitor, and improve. You can always evolve to model-driven approaches later.
In short, quant strategies aren’t about chasing signals. They’re about building a process, a repeatable machine that makes objective decisions using data, logic, and discipline.
Once you understand that, you’ll start thinking like a quant.
Getting Started with Quant Trading Tools and Skills
If you are new to quant trading, it can feel like there’s a lot to learn; and there is. But you don’t need to master everything at once.
Start with the basics, build gradually, and focus on becoming a consistent trader. The good news? Most of the tools and skills you need are either free or easy to access.
What Skills Do You Actually Need?
You don’t need to be a math genius or a software engineer to get started. But you do need some essential skills:
- Basic coding: You should know how to write simple scripts, loop through data, and call APIs. Python is the go-to.
- Understanding data: You’ll need to work with price data, clean it, and analyze it. Knowing how to use pandas (in Python) goes a long way.
- Statistical thinking: You should understand concepts like mean, variance, correlation, and standard deviation. Nothing fancy, just enough to validate your ideas.
- Financial market knowledge: Learn how markets behave. Know the difference between a limit order and a market order. Understand how volatility impacts execution.
If you are learning from scratch, start with Python and build from there. It’s the most flexible, beginner-friendly language used in quant trading.
Python vs. R (and Why Python Usually Wins)
- Python: The clear winner for most traders. Massive community, libraries like pandas, NumPy, scikit-learn, and integration with trading APIs.
- R: Good for statistical modeling, but less practical for end-to-end trading systems.
- Other languages: C++ is used in high-frequency trading, but it’s overkill for most beginners. JavaScript may be useful for crypto bots or UI dashboards.
Stick with Python. It covers 95% of what you will need.
Related Post:
5 Best Programming Languages for Algorithmic Trading
Tools & Platforms to Kickstart Your Journey
You don’t need to build everything from scratch. These platforms make it easier to learn, test, and execute your strategies.
Backtesting Platforms
- QuantConnect: Web-based platform with data, backtesting engine, and broker integration. Uses C# and Python.
- Backtrader: Open-source Python library for building and testing trading strategies locally. Great for flexibility and learning.
Broker APIs for Live Trading
- Alpaca: Commission-free stock trading with API access. Perfect for paper trading and live U.S. equities.
- Interactive Brokers (IBKR): Industry-standard for serious traders. Offers access to global markets and deep API support, though setup is more complex.
Crypto APIs & Platforms
- Binance: Leading crypto exchange with a powerful API. Great for testing crypto strategies across spot and futures.
- Bybit, Kraken, and KuCoin: Also offer reliable APIs for crypto trading.
- CCXT: A unified library that lets you connect to multiple crypto exchanges using a single codebase.
You can start coding a crypto strategy and run it through the Binance testnet without risking any capital.
Start With Paper Trading Before Going Live
Before risking real money, always start with paper trading; running your strategy in real market conditions using simulated capital.
Most platforms offer this feature:
- Alpaca: Built-in paper trading mode.
- Binance: Has a sandbox environment (testnet).
- QuantConnect: Lets you simulate trading with historical & live data.
Paper trading helps you catch bugs, understand execution issues, and fine-tune your risk settings without taking real losses.
Your First Steps (in order)
- Learn Python – Focus on pandas, NumPy, and API handling.
- Explore a backtesting platform – Try Backtrader or QuantConnect.
- Run basic strategies on paper – Even a moving average crossover is a great starting point.
- Review each trade – Log results, analyze edge, and tweak logic.
- Go live with small capital – Only after you’re confident with stability and performance.
Getting started with quant trading isn’t about building something flashy, it’s about building something that works. Start small, stay consistent, and let your tools and skills compound over time.
Building and Testing Your First Quant Strategy
Designing a quant strategy is about finding a repeatable edge. You are not trying to predict the future; you’re building a set of rules that can respond to market behavior in a consistent way.
The goal is simple: define a logic, test it with real data, and see if it holds up.
Let’s break it down step by step.
Step 1: Choose Your Market
Start by deciding where you want to trade. Each market has its own rhythm and behavior.
- Stocks: Great for medium to long-term strategies. Plenty of historical data and APIs.
- Crypto: Fast-moving and 24/7. Good for short-term or high-frequency systems.
- Forex: Highly liquid, often more sensitive to macro events and time zones.
Choose a market you understand. That helps when testing strategies and spotting when something feels off.
Step 2: Spot a Market Inefficiency
A quant strategy needs a reason to exist. That reason is often a market inefficiency, some pattern that repeats itself over time.
You’re asking:
“What behavior can I measure and take advantage of?”
Here are a few simple examples:
- Stocks that gap down and recover the next day.
- Crypto pairs that move in sync, then diverge briefly.
- Currencies that follow a trend during specific time windows.
Keep your idea simple. Complex strategies often fail because they’re overfitted or hard to test reliably.
Step 3: Pick a Strategy Type
There are three classic types of quant strategies. Most strategies you’ll come across fall into one of these categories.
1. Momentum
- Assumes assets that are moving in one direction will keep going.
- Example rule: Buy if price has increased for 5 straight days.
2. Mean Reversion
- Assumes prices revert back to average after moving too far.
- Example rule: Sell if the price moves 3% above its 10-day average.
3. Arbitrage
- Takes advantage of price differences across assets or exchanges.
- Example: Buy Bitcoin on Exchange A, sell on Exchange B at a higher price.
Momentum and mean reversion are great for beginners. Arbitrage trading needs faster execution and more capital.
Step 4: A Simple Strategy Example (Momentum)
Let’s build a basic moving average crossover strategy.
The logic:
- Buy when the short-term moving average (MA10) crosses above the long-term moving average (MA50).
- Sell when MA10 crosses below MA50.
- Trade only if average volume is above a threshold to avoid illiquid assets.
Step 5: Code a Basic Strategy in Python
Once your strategy logic is clear, the next step is to translate it into code so you can test and automate it.
If you’re using Python (which is the most common choice in quant trading), you’ll typically follow these steps:
- Collect historical price data from a data provider or API like Binance.
- Convert the data into a pandas DataFrame, which makes it easy to work with.
- Apply your strategy logic—for example, calculating moving averages, setting rules for entry and exit, and generating signals based on conditions.
- Create a new column for signals (like buy or sell) based on your logic.
- Shift the signal forward by one step to simulate real-world trading and avoid lookahead bias.
- Use the final DataFrame to review signals, visualize performance, and prepare it for backtesting or live execution.
You don’t need to be an expert programmer to do this. With some basic Python knowledge, especially using libraries like pandas; you can build and test your own strategy from scratch.
If you are just starting out, focus on making it work first. Clean code and optimization can come later.
Final Tip:
Don’t chase complexity early on. A strategy that works well and is easy to explain is more valuable than a complex one you barely understand.
Once your simple system works and you’ve tested it well, you can add filters, risk controls, or smarter logic over time.
The most important thing is to build something you can trust, test, and improve. That’s how real quant systems start.
Backtesting and Validating Your Strategy
Backtesting is where your strategy faces the truth.
It’s how you see if your logic would’ve worked in real markets using historical data. It doesn’t guarantee future success, but it tells you if your rules make sense or if you’re just fooling yourself.
Why Backtesting Matters
A strategy that looks great on paper isn’t useful until you test it with real past data.
Backtesting helps you answer basic but critical questions:
- Would this have actually made money?
- How big were the losses?
- Did it survive tough market conditions?
- Was it trading too often or not enough?
Without this step, you’re guessing. And guessing is just gambling in a suit.
But here’s the catch: you have to do it right.
Key Concepts You Need to Understand
Let’s simplify the core ideas every trader should know during backtesting:
In Sample vs. Out of Sample Testing
- In-sample data is the historical period you used to build your strategy.
- Out-of-sample is data you didn’t touch while developing.
Think of it like training a student on one exam paper, then testing them on another. If your strategy only works on the test it studied from, it probably won’t survive the real world.
Always reserve some data for validation, don’t test on what you trained with.
Overfitting and Data Snooping
This is where most beginner quants go wrong.
Overfitting means your strategy fits the past too well. It captures noise, not patterns. You’ll see perfect equity curves and crazy-high returns, but only in backtests.
Data snooping is when you keep testing ideas until something “works.” Eventually, something will look great just by chance.
Rule of thumb: if your strategy only looks good after 50 tweaks, it’s probably too fragile.
Performance Metrics That Actually Matter
Forget profit percentage. That doesn’t tell you the whole story.
Instead, track these:
- Sharpe Ratio – Measures return relative to risk. The higher, the better.
- Max Drawdown – Tells you the worst drop from a peak. Can you stomach it?
- CAGR (Compound Annual Growth Rate) – Shows how much your capital would grow annually.
- Win Rate & Avg. Trade Return – You want both working together, not just one.
Metrics tell you how a strategy makes money, not just if it does.
Tips to Improve Backtest Accuracy
To make your backtests more reliable:
- Avoid lookahead bias – Always base your trades on past data only, not future candles.
- Use realistic assumptions – Include slippage, commissions, and spreads.
- Don’t trust small sample sizes – A strategy that made 10 trades in a year isn’t proven.
- Test across multiple market conditions – Bull, bear, sideways. Your strategy should hold up, or at least not blow up.
- Log every trade – If you don’t understand why it took a trade, the logic isn’t clear enough.
Final Thought
Backtesting is where your idea becomes a real system. But don’t fall in love with the backtest. Respect it, question it, and use it to build confidence in your process not perfection.
A decent strategy with proper validation is worth far more than a perfect-looking backtest that only works on paper.
How to Interpret Backtest Results Like a Pro
Once you have backtested a strategy, the first thing you’ll probably look at is the equity curve.
And that’s fine, it’s a quick way to see if the strategy made money over time. But the equity curve alone doesn’t tell you the full story. To really know if your system is solid, you need to go deeper.
1. Trade Distributions: Where the Edge Really Lives
Look at the full list of trades. Are profits spread out or are a few trades doing all the heavy lifting?
If one or two trades account for most of the profits, that’s a red flag. It means the strategy might be relying on rare, lucky outcomes.
A solid system produces a repeatable pattern, not a lottery win.
Also check:
- How often do trades lose vs. win?
- Are losses much bigger than wins?
- Do results vary a lot by time of day or day of week?
Patterns matter. Consistency matters more.
2. Hit Ratio vs. Payoff Ratio
Don’t get obsessed with win rate. That’s only half the equation.
- Hit Ratio (Win Rate): % of trades that were profitable.
- Payoff Ratio: Average win divided by average loss.
A strategy with a 40% win rate can still be excellent if the average win is twice the size of the average loss.
3. Expectancy and Profit Factor
These are two of the most useful metrics most beginners skip over.
- Expectancy tells you how much you expect to make (on average) per trade.
If it’s negative, stop right there. - Profit Factor is the ratio of gross profit to gross loss.
A value above 1.5 is decent. Above 2.0 is strong.
Think of these as your “reliability gauges.” If they’re weak, even with a nice-looking equity curve, you’re probably sitting on a fragile system.
4. Regime Robustness: Does It Work in All Conditions?
The market changes constantly – bull, bear, sideways, high volatility, low volume.
Ask yourself:
- Did this strategy survive multiple market environments?
- Or was it only profitable during a strong trend or crash?
Split your backtest into segments. Compare how it performed during:
- Bull runs
- Selloffs
- Choppy markets
A good system might do great in one regime and average in others, that’s fine. But if it completely breaks in certain conditions, you need to add filters or rethink the core logic.
A Quick Example: Reading a Backtest Summary
Let’s say your backtest report shows:
- Win rate: 47%
- Avg. win: $120
- Avg. loss: $60
- Expectancy: $30 per trade
- Profit factor: 2.1
- Max drawdown: 12%
- Trades per month: 15
- Performance in (bear): -1.3%
- Performance in (sideways): +4.1%
- Performance in (bull): +16.5%
Here’s what that tells me:
- Even with a sub-50% win rate, the payoff ratio is excellent.
- The strategy is reliable (expectancy +$30 per trade) and efficient (profit factor over 2).
- It can survive tough markets, and thrives when conditions are favorable.
- Trade frequency is moderate, not too noisy, not too slow.
That’s a system I’d consider moving forward with. I’d still validate it out-of-sample, but these results show structure, not luck.
Final Note
Good results should make you trust the system, not get excited about a big number. If your strategy looks solid under the hood, you’re much more likely to stick with it when real money is on the line.
The Role of Data in Quantitative Trading
Data is everything in quant trading.
Your strategy is only as good as the data it runs on. If your data is wrong, outdated, or full of gaps, even the smartest model will lead you in the wrong direction.
That’s why understanding what type of data you need and how to work with it; is one of the most important parts of building a reliable trading system.
Types of Data You’ll Use
1. Price Data (OHLCV)
This is the backbone of most quant strategies.
- Open
- High
- Low
- Close
- Volume
You use this to build technical indicators, calculate moving averages, and define entry/exit rules. Most momentum, trend-following, and mean-reversion strategies are based on this.
2. Fundamental Data
Used mostly in equities and ETFs. Includes:
- Earnings
- P/E ratios
- Revenue growth
- Debt levels
If you’re building long-term or factor-based strategies, this data helps filter quality assets. Think value investing with a quant lens.
3. Alternative Data
This includes anything outside the traditional scope:
- Sentiment data from news headlines
- On-chain data in crypto (wallet activity, transaction volume)
- Social signals like Twitter buzz or Google search volume
It’s not about being fancy, it’s about finding new sources of edge. But alternative data often needs more cleaning and caution.
How to Source Good Data
Bad data will ruin your backtest. It can show false signals, hide risk, or make a strategy look better than it really is.
Free Data Sources (Good for Starting Out)
- Binance API – Crypto data with solid coverage
- Alpaca – U.S. equities with clean historical data
- CoinGecko & CoinMarketCap – Free crypto market stats
- Tiingo (limited free tier) – Higher quality pricing data
Paid Data Sources (When You Scale Up)
- Polygon.io – Real-time and historical U.S. market data
- Quandl (now Nasdaq Data Link) – Financial & macro data
- Intrinio / EODHistoricalData – Easy-to-use APIs for stocks, fundamentals, and FX
- CryptoQuant, Glassnode – On-chain data for advanced crypto analysis
If you’re serious about accuracy, paid data is worth the cost once your strategy shows promise.
Data Cleaning and Preparation: Don’t Skip This
Even great data needs to be cleaned before it’s usable. Here’s what I check:
- Missing values – Fill gaps carefully. Don’t assume zero is correct.
- Timezone alignment – Make sure all timestamps match your strategy’s time frame.
- Split and dividend adjustments – Especially for stock data. Use adjusted close when needed.
- Outliers or spikes – Filter sudden price jumps from bad ticks or errors.
- Consistent formatting – Keep your column names, formats, and timeframes standardized across all datasets.
Most beginners skip this step, then wonder why their backtest results look strange.
Clean, reliable data = trustworthy results. It’s not the fun part, but it’s one of the things that separates hobby traders from professionals.
Final Thought
Think of data as the foundation of your quant system. If it’s weak or flawed, everything else crumbles.
Get this part right and everything that follows: your signals, backtests, and live execution will be more accurate, more stable, and more trustworthy.
Executing Trades with Precision: Automation and Order Handling
Designing a solid strategy is only half the job. The other half is execution, actually getting your trades into the market in a way that reflects your backtest.
If you ignore this step, your performance in live trading won’t match what you saw during testing.
That’s where many traders go wrong. They build a strategy that looks great on paper but lose money live because their execution is slow, sloppy, or too aggressive.
Let’s talk about how to bridge that gap.
From Model to Market: Making Your Strategy Trade
Once your system generates a signal, you need a way to act on it: automatically, quickly, and reliably. This is where APIs, broker connections, and execution logic come in.
You’ll write a script or use a platform that watches for trade signals in real-time and sends orders to your broker or exchange.
Platforms like Alpaca (stocks) or Binance (crypto) make this possible with developer-friendly APIs that let you place, cancel, and track orders programmatically.
Choosing the Right Order Type
Using the wrong type of order can ruin a good trade. Here are the main types:
- Market Order: Fills instantly at the current price. Fast but may suffer slippage in thin markets.
- Limit Order: You set the price. It only fills if the market hits it. Good for control, but may miss the move.
- Stop Order: Triggers a market order once a certain price is reached. Useful for managing exits.
- Algorithmic Order: Splits large trades into smaller ones, often based on volume or time. Helps avoid detection and reduce slippage.
If you’re running low-frequency systems, limit orders often make sense. For fast-moving markets (like crypto), market orders might be safer for ensuring execution, just be aware of the cost.
Understand Slippage, Latency & Order Routing
Here’s what affects real-world execution:
- Slippage: The difference between expected price and actual fill price. It happens when the market moves while your order is being processed.
- Latency: The delay between when your signal triggers and when the order reaches the exchange. Even milliseconds can matter in fast markets.
- Order Routing: Where your order gets sent. Some brokers route to internal networks, while others offer access to multiple exchanges or liquidity providers.
For example, a backtest may assume you get filled instantly at the close price. But in live trading, that rarely happens.
The real world is messy. And if you don’t factor in slippage and latency, your strategy may underperform.
Automating Your Trading System
Manual trading doesn’t work with quant strategies. Once your rules are clear, automation is the goal.
You can set up automation using:
- APIs from brokers (e.g. Binance, Alpaca, Interactive Brokers)
- Schedulers like
cron(Linux/macOS) or Task Scheduler (Windows) to run scripts at specific intervals - Cloud services like AWS, PythonAnywhere, or Google Cloud to host your bot 24/7
For example:
- Your script checks prices every 15 minutes.
- If your signal conditions are met, it places an order via API.
- It logs the result and sends you an alert.
Once everything is stable, you can walk away from the screen knowing your system is working without micromanagement.
Final Thought
Strong execution isn’t about speed alone, it’s about reliability and control. If your orders don’t go through as expected, your edge disappears fast.
That’s why I always tell new traders: don’t stop at backtesting. Build with real execution in mind from the start.
A good strategy with clean execution will outperform a brilliant system that can’t trade properly.
Smart Execution Techniques for Retail Quant Traders
Execution is where retail traders often give back their edge; especially in fast or thin markets. You might have a strong strategy, but if your fills are poor, your profits will slip away quietly.
Institutions spend millions optimizing execution. As a retail quant, you don’t need to match that, but you do need to be intentional about how your orders hit the market.
Let’s look at a few practical techniques you can apply even with a small account.
1. Randomized Order Timing
If your system fires the same high volume order at the same time every day (say, exactly at 9:30 AM or 2:00 PM), you create a pattern.
And patterns get picked off, especially in crypto or illiquid stocks.
Instead, introduce slight randomness:
- Place your order within a 30-second window
- Use small delays in script execution
- Randomize between limit and market orders based on liquidity
It’s a simple change that can help reduce impact and avoid being predictable.
2. Volume Participation Logic
Rather than pushing your full order all at once, you can trade as a % of current volume. This is common in institutional execution and can be applied on a smaller scale too.
For example:
Only send an order if current 1-minute volume exceeds 50,000 units, and limit your size to 2% of that.
This approach:
- Helps avoid moving the price
- Keeps your trades under the radar
- Makes your execution scale with liquidity
Even if you’re only trading small size, following volume helps you avoid awkward fills during quiet periods in illiquid markets.
3. Avoid Signaling to the Market
If you place visible limit orders far from the bid/ask spread, you might tip your hand, especially in crypto or low-volume assets.
Some ways to avoid this:
- Use iceberg orders (only part of the order is visible)
- Break large orders into small chunks over time
- Avoid stacking orders that create visible walls in the order book
Retail platforms don’t always offer advanced order types, but by keeping size small, using limit orders close to market, and avoiding predictable behavior, you reduce exposure.
4. Smart Order Routing Basics
Not all brokers are equal when it comes to routing your order.
Some send it to the cheapest internal venue. Others route to multiple exchanges for best execution. In crypto, some platforms offer deeper liquidity by pulling from multiple books (aggregators).
What you can do:
- Choose brokers that offer direct market access or routing transparency
- For crypto, use exchanges with deep books (Binance, Bybit) or APIs that support routing settings
- Avoid brokers that consistently give you poor fills or delay confirmations
Execution quality varies widely, even if the interface looks polished.
5. Simulating Realistic Fills During Backtesting
Most backtests assume “perfect fills.” That’s dangerous.
Instead, bake in execution logic:
- Slippage assumptions: Add a buffer to each entry/exit
- Limit order modeling: Simulate order queueing and partial fills
- Latency models: Delay trades slightly to reflect real-world API lag
If your strategy depends on getting exact prices, it’s probably not viable live. Simulating friction now saves money later.
Final Thought
As a retail quant, you can’t control the market, but you can control how you interact with it.
Execution doesn’t need to be perfect. It needs to be smart. Quiet, adaptive, and respectful of market structure.
A few changes like avoiding fixed times, trading with volume, and simulating slippage can add up to real improvements in performance. That’s where you start protecting your edge.
Risk Management in Quantitative Trading Strategies
If there’s one thing that separates serious traders from lucky ones, it’s risk management.
You can have a great strategy, clean execution, and good data but if you ignore risk, it only takes one bad day to wipe out months or years of progress.
In quant trading, risk management isn’t just a safety net, it’s a core part of the system. Every decision you make should be designed to protect capital first and grow it second.
Why Risk Management Matters in Quant Systems
Unlike discretionary trading, quant strategies don’t “feel” when something is wrong. They follow the rules, whether the market’s stable or going off the rails.
That’s why you need to bake risk controls into the system.
Without it:
- A string of losses can spiral out of control.
- Leverage can magnify small errors into big ones.
- Overexposure to a single market or strategy can wreck your portfolio.
Even a small strategy needs a clear plan for how much to risk, when to cut losses, and how to prevent overtrading.
Key Techniques to Manage Exposure & Protect Capital
1. Position Sizing Models
How much you put into each trade is more important than when you trade.
Popular approaches include:
- Fixed fractional: Risk a set % of your capital per trade (e.g., 1%).
- Volatility-adjusted sizing: Allocate less to volatile assets, more to stable ones.
- Kelly Criterion (scaled down): Uses probability and payoff to calculate optimal bet size. Good in theory, aggressive in practice—best used conservatively.
A well-sized trade feels boring. And that’s a good thing.
2. Stop-Loss Strategies
Every trade should have an exit plan, both for profit and protection.
Types of stop-losses:
- Static stop: A fixed percentage below your entry (e.g., 2%).
- ATR-based stop: Dynamic, based on asset volatility.
- Time-based stop: Exit after a set time if trade hasn’t moved.
Stops should match the personality of the strategy. For example, a mean-reversion setup might need tighter stops than a trend-following system.
Also consider portfolio-wide stops. For instance: if equity drops 10% from peak, pause all systems for review.
3. Diversification (Beyond Just Assets)
Diversification isn’t just holding different coins or stocks. In quant trading, you want to diversify across:
- Strategies (momentum, reversion, news-based)
- Timeframes (short-term, swing, longer-term)
- Markets (stocks, crypto, FX, indices)
If one strategy fails or a market shifts, the others can help smooth your returns. Just make sure the strategies aren’t all reacting to the same signals in different ways, that’s pseudo diversification.
How to Measure and Control Risk at the Strategy Level
Here are a few ways I track risk per system:
- Max drawdown: What’s the worst loss from a peak? Set limits and alerts.
- Value at Risk (VaR): Estimates worst-case loss in normal market conditions.
- Exposure limits: Cap the % of your total portfolio one strategy or asset can control.
- Rolling Sharpe ratio: Measures how risk-adjusted returns are holding up over time, not just in one good month.
Also, track daily or weekly volatility in P&L. If it’s spiking, something’s off, maybe your market conditions changed, or the strategy needs re-tuning.
Final Thought
Risk isn’t something you react to after a loss. It’s something you plan for before you ever click “run.”
Smart quant systems are not just about maximizing returns. They’re about surviving long enough to let your edge play out. The goal is consistency, not excitement.
If your strategy makes money slowly and safely, that’s not boring, that’s professional.
Portfolio of Strategies: Building a Robust System
One strategy is never enough.
Even if it looks great in backtesting, market conditions change and your once-reliable system can go cold.
That’s why professional quants don’t rely on a single strategy. They build portfolios of strategies that balance each other out.
Your edge doesn’t need to come from precision. It can come from structure.
Why Combine Multiple Strategies?
The goal isn’t to chase perfection. It’s to reduce reliance on any one method, market, or timeframe.
Here’s what happens when you trade one “great” strategy:
- It performs well in certain market conditions.
- Then it breaks when the market changes.
- You panic, pause, or worse, tweak it into something unrecognizable.
Now compare that to a portfolio:
- Strategy A does well in trending markets.
- Strategy B thrives during mean-reverting phases.
- Strategy C adds slow, steady gains over time.
Each has strengths and weaknesses, but together, they smooth out the bumps.
Diversify Across Timeframes, Markets & Logic
You don’t need 10 different assets. You need 3–5 systems that behave differently.
Here’s how to think about diversification:
- Timeframes:
Mix short-term intraday logic with longer swing or weekly systems. - Markets:
Run one system on crypto, another on equities, and a third on ETFs or forex.
This reduces risk when one market goes quiet or erratic. - Logic types:
Don’t just tweak parameters. Build different ideas.
For example:- One momentum-based breakout model
- One mean-reversion scanner for oversold setups
- One volume-based trend filter
If they’re truly different, their losses won’t overlap.
Use a Correlation Matrix to Guide Your Mix
A quick way to check if your strategies are too similar is to build a correlation matrix of their daily or weekly returns.
- If two strategies have a correlation above 0.80, they probably behave the same.
- If you find pairs with zero or negative correlation, those are ideal for combining.
This doesn’t need to be complex. Even in Excel or pandas, you can track it. The lower the off-diagonal numbers, the more robust your system mix becomes.
An Example: Two “Average” Strategies Beat One “Great” One
Let’s say:
- Strategy A has 60% win rate, 12% CAGR, 10% drawdown.
- Strategy B has 52% win rate, 9% CAGR, 8% drawdown.
- Strategy C (your star) has 70% win rate, 20% CAGR, but a 25% drawdown.
Most traders would go all-in on Strategy C. But when the drawdown hits, they freeze or exit early.
Now combine A and B. Because they’re uncorrelated:
- You get smoother equity growth.
- Drawdowns are smaller and shorter.
- The psychological stress is lower, which helps you stick with the plan.
In practice, your actual returns may not be as high as the “star” strategy, but your risk-adjusted return will be stronger. And more stable.
Final Thought
Building a portfolio of strategies is not just about being smart. It’s about building something you can stick with.
When you combine different systems that don’t all win or lose together, you give yourself breathing room. You create a setup that can handle noise, regime shifts, and uncertainty.
Consistency beats brilliance. Always.
Scaling Your Quant Strategies
Once you’ve built and tested a working strategy or better yet, a small portfolio of them, the next step is scale.
This is where you move from small tests to meaningful capital, real automation, and potentially outside investors.
Scaling isn’t about adding more risk. It’s about increasing size without losing control.
From Backtesting to Live Trading
You’ve tested your strategy. The results look solid. But backtest results are just a starting point. Live trading is where you find out if the system actually holds up.
Before going live:
- Start with paper trading on real market data.
- Track execution quality and make sure your trades are being placed correctly.
- Watch for behavioral gaps, things that didn’t show up in backtests (like slippage or missed orders).
Once you are confident in stability and accuracy, begin live trading with small capital. This is your “production test.” Think of it as your soft launch.
Managing Larger Portfolios & Multiple Strategies
When you add capital or add strategies: you increase complexity.
Here’s how to manage growth without losing control:
- Centralized logging & monitoring: Track all trades across systems from one dashboard.
- Position limits: Set caps per strategy and per asset to avoid unintended risk.
- Capital allocation logic: Don’t split capital evenly. Allocate based on volatility, past performance, and risk-adjusted return.
Use tracking tools to keep an eye on:
- Combined drawdowns
- Cross-strategy correlations
- Exposure overlaps (e.g., two strategies both long BTC at the same time)
Scaling well is about keeping systems independent but supervised.
When to Consider Outside Capital or Fund Launch
If you’ve built a repeatable track record, preferably audited or at least well-logged, you may start attracting interest from others.
Here’s when it might make sense:
- You’ve been consistently profitable for at least 18–24 months.
- Your system works with larger size (i.e., scalable liquidity).
- You’ve tested your edge across real accounts, not just backtests.
Options:
- Prop firms: Some offer capital in exchange for a performance split.
- Friends & family capital: Can work, but tread carefully, treat it like professional money.
- Launching a fund: Requires legal structure, compliance, admin overhead. Don’t rush this.
Start small. Scaling capital should always follow system maturity, not the other way around.
Using Cloud Infrastructure to Support Automation
Running one strategy from your laptop works. Running five, 24/7, doesn’t.
Here’s where cloud tools come in:
- AWS / Google Cloud / DigitalOcean: Run scripts on a schedule (e.g., every 15 mins or hourly).
- PythonAnywhere or Replit: Easy for smaller bots and automation workflows.
- Cron jobs / Task schedulers: Automate daily trade signals, performance tracking, and rebalancing.
- Git + backups: Keep code versioned, secured, and recoverable.
Cloud automation lets you:
- Trade multiple systems without manual effort
- Run nightly rebalances or checks
- Get alerts when things go wrong
Even if you’re not a full-time developer, there are no-code tools and affordable VPS setups that make it easier than ever to automate responsibly.
Final Thought
Scaling isn’t about trading bigger. It’s about thinking bigger while staying disciplined.
If you treat your trading like a business from the start, scaling becomes a natural next step. It’s not about chasing performance.
It’s about building structure that lasts, whether you’re managing your own capital or someone else’s.
Deploying a Quant System in Production
Once your strategy is tested and ready to go live, it’s time to think like a builder, not just a trader.
You need a reliable system that can run on its own, handle real-time data, place orders, and alert you when something goes wrong.
This step is often where beginner quants hesitate. But setting up a live quant system doesn’t require a full engineering team.
With the right tools and simple workflows, you can run a production-ready setup that’s lean, stable, and automated.
Key Tools & Setup for a Clean Deployment
1. Use Git for Version Control
If you’re updating your strategy code regularly, version control is non-negotiable.
- Git helps you track changes, roll back to previous versions, and avoid overwriting working code.
- Platforms like GitHub or GitLab also let you document your strategy logic and keep a changelog.
Even as a solo trader, Git gives structure to your process and avoids costly mistakes like “breaking” something that used to work.
2. Use Cloud Services to Run Your Bot 24/7
Your strategy won’t help if it’s sitting on a laptop that’s turned off.
Cloud services let you run your trading system continuously with stability and security:
- AWS Lambda or Google Cloud Functions – Great for lightweight, scheduled tasks.
- DigitalOcean / Linode / Contabo VPS – Affordable options to host full trading bots.
- PythonAnywhere – Easy platform for running and scheduling Python scripts.
You can set up scheduled jobs to:
- Check market data
- Run signals
- Send trades via broker API
- Log actions and performance
No need to babysit it. Just keep it monitored.
3. Automate Scripts & Set Alerts
Automation handles the grunt work. Your system should be able to:
- Wake up at a scheduled time (using cron or task schedulers)
- Pull fresh data
- Generate signals
- Place trades
- Log actions in a CSV, database, or dashboard
Set up alerts so you’re notified of:
- Trade failures
- Connection errors
- Strategy hitting drawdown thresholds
Use email, Telegram bots, or webhook services like IFTTT or Pushover to keep tabs without constantly watching screens.
4. Monitor Live Performance & Logs
Live tracking is your early warning system.
You should:
- Log every trade with timestamp, price, signal, and result.
- Track cumulative P&L, drawdowns, and exposure.
- Compare live trades against your backtest to catch mismatches early.
You can monitor performance in a basic spreadsheet, or use tools like:
- Google Sheets (with API connectors)
- Simple dashboards via Streamlit or Flask (for coders)
- Cloud-based analytics tools (if you scale)
If something goes off track, you want to catch it early, not after 20 bad trades.
Example Deployment Setup (Retail Quant)
Here’s what a simple but solid setup could look like:
- Strategy code written in Python and managed via GitHub
- Runs daily via cron job on a VPS (e.g., DigitalOcean)
- Connects to Binance API to fetch data and place trades
- Logs trades to a Google Sheet via API
- Sends alerts via Telegram when trades are placed or errors occur
- Backed up weekly using Git and offsite file storage
It’s lightweight, easy to manage, and doesn’t require enterprise tools.
Final Thought
Going live is where you shift from theory to operation. The key is building something you can trust and that starts with process.
You don’t need the fanciest tech stack. You need reliability, transparency, and control. Once that’s in place, you can scale or iterate without fear.
Because you’re not just trading, you’re running a system. And that’s a big shift in mindset.
Strategy Lifecycle: From Concept to Retirement
No strategy lasts forever.
Markets evolve, and your edge can fade without warning. That’s why every system needs a clear lifecycle from idea to retirement with regular checkpoints along the way.
Here’s the short version:
- Development: Turn your idea into a working model and run basic backtests.
- Validation: Stress test with out-of-sample data and realistic assumptions like slippage.
- Deployment: Go live with small capital. Monitor fills, execution, and stability.
- Monitoring: Track performance over time. Look for signs of drift—like falling win rates or increased volatility.
- Retirement: If the edge weakens or results deviate too far from expectations, pause or retire the system.
You don’t need to overreact but you do need to review regularly. I revisit my strategies every quarter. Some get updates. Others get shelved.
That’s part of the process. Good systems run. Great systems adapt.
Emerging Trends in Quantitative Finance
Quantitative trading is not standing still. The tools, data, and techniques we use today are evolving fast and if you want to stay relevant, you need to keep an eye on what’s next.
Here are some of the most important trends shaping the future of quant finance.
Machine Learning & AI in Quant Strategies
More quants are now integrating machine learning models into their systems, especially for pattern recognition, dynamic signal generation, and parameter tuning.
Some practical use cases:
- Classifying market regimes (bull vs. bear)
- Predicting short-term returns based on multi-factor inputs
- Adjusting position sizing based on historical volatility patterns
But let’s be clear, AI doesn’t guarantee profits. The challenge isn’t training the model, it’s avoiding overfitting and interpreting results in real market terms.
Related Article:
AI in Trading: Can a Machine Learn to Beat the Market?
NLP & Sentiment-Based Trading Models
Natural Language Processing (NLP) has become more useful for extracting signals from news, earnings reports, and even social media.
Traders now:
- Analyze headlines to detect positive/negative sentiment
- Scrape Reddit or X (formerly Twitter) for early buzz on assets
- Track changes in central bank statements or corporate filings
These models can work, especially in fast-moving markets like crypto. But again, the signal has to be strong enough to overcome noise and tested thoroughly before going live.
Alternative Data & Crowdsourced Research
Access to non-traditional data is leveling the playing field.
What used to be reserved for hedge funds is now open to retail:
- Google Trends, weather patterns, satellite imagery
- On-chain crypto data (wallet activity, exchange flows)
- User-generated strategies on platforms like QuantConnect or Numerai
Even basic alternative data, like earnings call transcripts or GitHub activity in crypto projects, can add an edge if used thoughtfully.
Just don’t assume more data means better results. The key is using data that aligns with your strategy’s logic not just adding noise.
Regulations & Future Challenges
As quant systems grow more automated and more global, regulators are catching up.
Things to watch:
- Market abuse and manipulation rules, especially for sentiment-based or fast-reacting bots
- Data privacy laws (like GDPR, DPDPA) if you’re scraping or storing user-level information
- Licensing requirements for managing outside capital or launching a fund
Also, the arms race in automation is real. Alpha decay is faster than ever. A strategy that worked last year might not survive this year’s conditions.
That’s why adaptability is no longer optional, it’s your biggest edge going forward.
Final Thought
Quant trading is shifting from static strategies to dynamic systems, powered by smarter tools and richer data.
But the core principles still matter: clean logic, strong risk control, and disciplined execution.
Trends are useful. But your edge will always come from how well you apply them.
Developing a Quantitative Research Mindset
If you want to become a serious quant trader, you need to stop thinking like a trader and start thinking like a researcher.
That means every strategy you build, every pattern you think you’ve spotted, and every backtest you run should start with a simple question:
“Can I prove this actually works?”
Start With a Hypothesis, Not a Hunch
Before jumping into coding or backtesting, take a step back and write down what you believe might be true. That’s your hypothesis.
For example:
- “Crypto assets tend to mean-revert after large volume spikes.”
- “Mid-cap stocks outperform during the first 5 trading days of each month.”
The key is to make it specific and testable. You’re not just throwing ideas at a chart, you’re framing a rule that can be evaluated with data.
Validate With Real Statistical Thinking
Once you test a hypothesis, you need to understand why the results look the way they do.
Basic tools to rely on:
- P-values: Helps you judge whether your results are statistically significant or just random.
- Confidence intervals: Shows the expected range of outcomes. Helps with risk planning.
- Sample size checks: A strategy that worked on 20 trades isn’t validated. Look for consistency over hundreds.
You don’t need to be a statistics professor but you should be able to explain why your results hold up, not just that they “look good.”
Log Everything: Journaling & Research Notes
Keep a research notebook: digital or physical.
Document:
- The idea you tested
- Why you believed it had an edge
- How it performed (metrics, charts, trade logs)
- What you learned and what’s next
This helps in two ways:
- You can revisit old ideas later with fresh data or context.
- It keeps you honest and structured, especially when a strategy underperforms.
Watch Out for Biases
Even in data-driven trading, your brain can trick you.
- Confirmation bias: Looking for results that confirm what you already believe.
- Survivorship bias: Testing only assets that still exist (ignoring the ones that failed).
- Overfitting: Creating a strategy that fits past data perfectly but fails miserably live.
The fix? Be skeptical.
Always ask: “If this didn’t work, why not?”
That question alone can save you from launching a flawed system.
Related Article:
7 Biases Affecting Investors & Traders (and How to Outsmart Them)
Final Thought
Quant trading is about thinking clearly, testing thoroughly, and staying honest with yourself.
A research-first mindset isn’t just about doing more analysis. It’s about creating repeatable logic that you trust because you’ve seen the evidence, not just the equity curve.
Trade like a builder. Think like a researcher. That’s how you build real, lasting edges.
Quant Checklist: Are You Ready to Go Live?
Before you switch on live trading, hit pause for a moment and double-check the essentials. Going live too early is one of the easiest ways to lose money even with a good strategy.
Here’s a quick checklist to confirm if a system is truly ready for real capital:
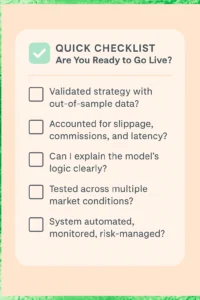
Final Reminder
Going live doesn’t mean going big. Start small, observe how it behaves, and scale only when you trust every part of the pipeline.
If you can check all these boxes with confidence, you’re ready.
Top Tools and Libraries to start Quant Trading
You don’t need to build everything from scratch. The right tools save time, reduce bugs, and let you focus on what matters: strategy logic and performance.
Here’s a quick-reference list of practical tools for traders getting started with quant systems:
| Purpose | Tool/Platform | Notes |
|---|---|---|
| Backtesting | Backtrader, QuantConnect | Python-based, flexible, widely used |
| Data Sourcing | Tiingo, Quandl | Free and paid APIs; good coverage |
| Execution APIs | Alpaca, IBKR (Interactive Brokers) | Real-time trade automation support |
| ML/NLP Libraries | scikit-learn, XGBoost, HuggingFace | Great for machine learning models |
| Deployment | AWS Lambda, GitHub Actions | Automate & schedule trading scripts |
These tools cover the full workflow, from idea to execution. You don’t need all of them at once. Pick what fits your current stage and scale up as your systems grow.
Most of these have strong community support, clean documentation, and low or no cost to get started.
Frequently Asked Questions (FAQs)
Is quant trading suitable for beginners?
Yes, quant trading is beginner-friendly with the right tools. You can start with simple strategies, free data sources, and basic platforms, no advanced math or large capital required.
Do I need to learn programming to become a quant trader?
Basic programming helps, especially in Python, but it’s not mandatory. Low-code and no-code platforms like QuantConnect or TradingView allow non-coders to build and test quant strategies.
How much capital is needed to start quant trading?
You can start quant trading with $0 using paper trading tools. For live trading, a minimum of $1,000–$10,000 is recommended to handle real-world slippage, fees, and drawdowns.
What’s the difference between quant and algo trading?
Quant trading focuses on data-driven strategy design, while algorithmic trading handles automated execution. Many quant strategies are also algo-traded for speed and consistency.
What are common mistakes to avoid in quant trading?
Avoid these key mistakes:
1. Overfitting backtests
2. Ignoring trading fees and slippage
3. Poor risk management
4. Failing to validate with out-of-sample data
5. Automating unproven strategies
Each can lead to unexpected losses in live trading.
Conclusion and Next Steps
Quantitative trading isn’t about predicting the future, it’s about building a repeatable system that makes decisions based on data, not emotion.
If you’re just starting out, don’t worry about being perfect. Start small. Focus on building one strategy, testing it properly, and understanding how it behaves.
Over time, your skills, tools, and confidence will grow.
The best part? You don’t need a finance degree or massive capital to get started. With free data, open-source tools, and a structured mindset, anyone can begin developing their own trading systems.
Next Steps:
- Pick one market: stocks, crypto, or forex and learn its behavior.
- Build a simple rule-based strategy. Backtest it. Track results.
- Use paper trading to test it in real conditions without risking capital.
- Gradually automate and scale once you’ve built trust in your process.
Quant trading rewards discipline, not speed. With the right approach, you’ll be able to build systems you understand, control, and continuously improve.
You’re not just trading anymore, you’re building something that lasts.
Disclaimer:
This content is for informational purposes only and should not be considered financial advice.
Read full Disclaimer.